

- Published on
Drupal Earth, lift-off 🚀
- Authors
- Name
- Christophe Jossart
- @colorfield


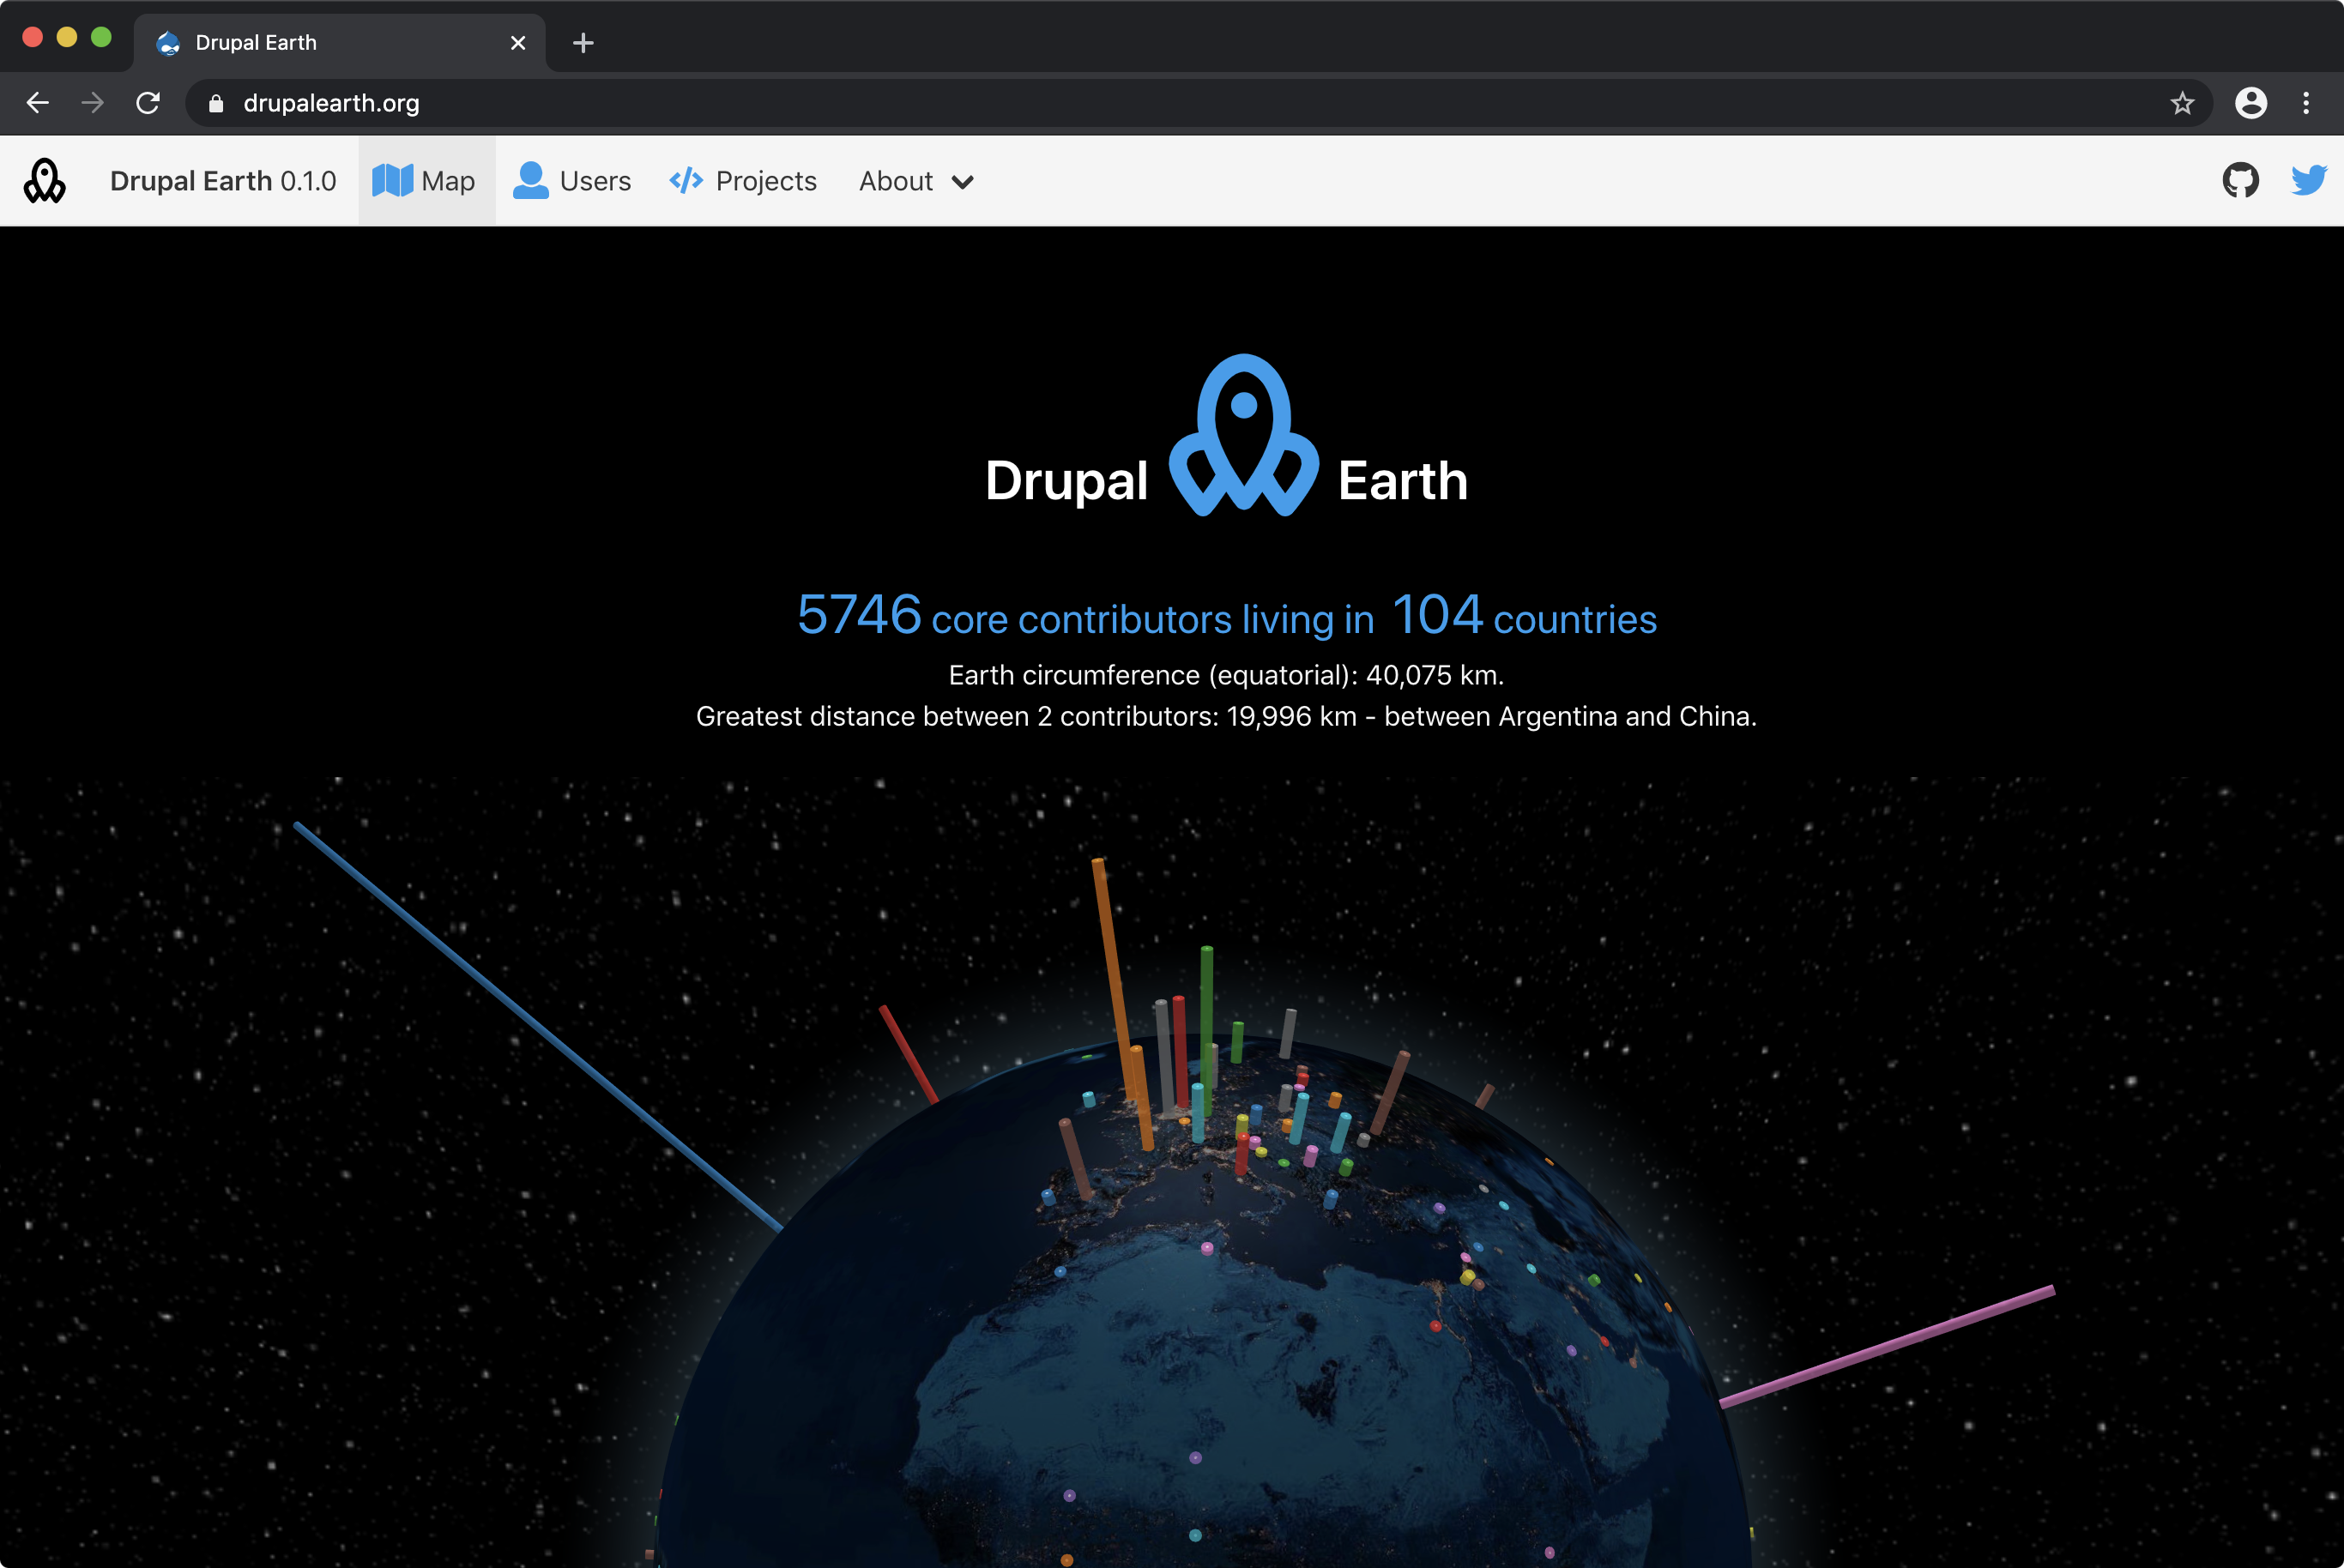
The planet Drupal has now some data visualization based on Three.js an D3.js
This project started as a playground to become a bit more familiar with Python, aggregating data from the Drupal.org APIs to answer two specific questions: where are the Drupal peeps out there and what is the greatest distance between 2 Drupal contributors?
Then a few other questions quickly followed:
- how are they contributing?
- which languages are they talking?
- how many core contributors joined, by year?
- what are they working on?
- ...
It would also be nice to answer questions related to projects:
- what is the core version usage by year
- and get the same idea for contributed projects
While some of these data are available as is on Drupal.org, I wanted a new way to visualize them, so picked a few frameworks:
- React and Bulma for the UI
- Three.js + React Globe and D3.js for the 3D
- Nivo.rocks as an abstraction layer for D3.js charts and the React integration.
we can then answer the above questions on Drupalearth.org

Roadmap
This is still a playground so the roadmap is subject to change but the first things that I'd like to work on are:
- Weekly incremental update and monthly full update
- Extend data from core contributors to all Drupal users
- Add 3D map controls
- Add filters (filter projects by version, users by contribution type, ...)
- Add other aggregations and improve results
- Improve the UI
- SSR / PWA / Gatsby